Probability
Table of Contents
Probability has become the default model for apparently random phenomena. Given a random experiment a probability measure is a population quantity that summarizes the randomness. When we talk about probability we are not refering to the observations (the data collected), rather we refer to a conceptual property of the population that we would like to estimate.
Kolmogorov’s axioms
Let $(\Omega, F, P)$ be a measure space with $P$ being the probability of some event $E$, denoted $P(E)$, and $P(\Omega) = 1$. Then $(\Omega, F, P)$ is a probability space, with sample space $\Omega$, event space $F$ and probability measure $P$.
- Non-negativity
The probability of an event is a non-negative number:
$$P(E) \in \mathbb{R},\ P(E) \ge 0 \ \forall \ E \in F$$
- Normalization
This is the assumption of unit measure: that the probability that at least one of the elementary events in the entire sample space will occur is 1.
$$P(\Omega) = 1$$
- Countable additivity
This is the assumption of sigma-addtivity:
$$P\left( \bigcup\limits_{i=1}^{\infty}E_i\right)=\sum\limits_{i=1}^{\infty}P(E_{i})$$
Consequences
Monotonicity
If $$A \subseteq B$$ then $$P(A) \le P(B)$$The Probability of an empty set
$$P(\emptyset )=0$$
- The complement rule
$$P(A^c)=P(\Omega|A)=1-P(A)$$
- The Numeric Bound
It immediatly folows from the monotonicity property that
$$0 \le P(E) \le1 \ \forall \ E \in F$$
Further Consequences
- The Additional Law of Probability or The Sum Rule
$$P(A \cup B) = P(A) + P(B) - P(A \cap B)$$ If $$P(A \cap B) = 0 \therefore P(A \cup B) = P(A) + P(B)$$
Example 1.1
Suppose you rolled the fair die twice in succession. What is the probability of rolling two 4’s?
Answer: $1/36$
Suppose you rolled the fair die twice. What is the probability of rolling the same number two times in a row?
Answer: $1/6$
Since we don’t care what the outcome of the first roll is, its probability is $1$. The second roll of the dice has to match the outcome of the first, so that has a probability of $1/6$. The probability of both events occurring is $1 * 1/6$.
Probability Mass Functions and Densities
Probability mass and density functions are a way to mathematically characterize the population.
For all kinds of random variables (discrete or continuous) 1, we need a convenient mathematical function to model the probabilities of collections of realizations. These functions, called mass functions and densities, take possible values of the random variables, and assign the associated probabilities; they describe the population of interest.
So, consider the most famous density, the normal distribution. Saying that body mass indices follow a normal distribution is a statement about the population of interest. The goal is to use our data to figure out things about that normal distribution, where it’s centered, how spread out it is and even whether our assumption of normality is warranted!
A probability mass function (PMF) is a function that gives the probability that a discrete random variable is exactly equal to some value. Sometimes it is also known as the discrete density function. The probability mass function is often the primary means of defining a discrete probability distribution, and such functions exist for either scalar 2 or multivariate random variables 3 whose domain is discrete.
A probability mass function differs from a probability density function (PDF) in that the latter is associated with continuous rather than discrete random variables. A PDF must be integrated over an interval to yield a probability.
PMF Formal Definition
Notation: an upper case $X$ to denote a random, unrealized, variable and a lowercase $x$ to denote an observed number.
The function $p:\mathbb{R} \rightarrow [0,1]$ defined by
$$p_X(x_i)=P(X=x_i) $$ for $-\infty<x<\infty$, where $P$ is a probability measure.
The probabilities associated with each possible values must be positive and sum up to 1. For all other values, the probabilities need to be 0.
$$ \sum p_X(x_i)=1$$ $$ p(x_i)>0 $$ $$ p(x)=0, \ \ \text{for all other} \ x.$$
Example 1.2
For instance, suppose we have a coin which may or may not be fair. Let $x=0$ represent a ‘heads’ outcome and $x=1$ represent a ‘tails’ outcome of a coin toss. Let $p$ be the probability of ‘heads’. Then,
$$p^{1-x} \ (1-p)^x$$
represents the PMF of the coin toss.
PDF Formal Definition
For the case when $X$ is a $\mathbb{R}$ we need to think about the probability that $x$ is close to a single number.
We capture the notion of being close to a number with a probability density function which is often denoted by $\rho(x)$. If the probability density around a point $x$ is large, that means the random variable $X$ is likely to be close to $x$.
Assuming $\rho$ is continuous, the probability that $X$ is in that interval will depend both on the density $\rho(x)$ and the length of the interval:
$$Pr(X \in I_x) \approx \rho(x) \ Length \ of \ I_x$$
In general, to determine the probability that $X$ is in any subset $A$ of the real numbers, we simply integrate the function $\rho(x)$ over the set $A$. The probability that $X$ is in $A$ is precisely
$$Pr(x\in A)=\int_A \rho(x)dx$$
For example, if $I$ is the interval $I=[a,b]$ with $a\leq b$, then the probability that $a\leq X\leq b$ is
$$Pr(x\in I)=\int_I \rho(x)dx=\int_a^b \rho(x)dx$$
For a function $\rho(x)$ to be a probability density function, it must satisfy two conditions:
$$ \rho(x) \geq 0 \ \ \forall \ x$$
$$\int \rho(x)dx=1$$
Cumulative and Survival Functions
The cumulative distribution function (CDF) of a random variable $X$, either discrete or continuous, is the function $F(x)$ equal to the probability that $X$ is less than or equal to $x$.
When the random variable is continuous, the PDF is the derivative of the CDF. So integrating the PDF (the line represented by the diagonal) yields the CDF. When you evaluate the CDF at the limits of integration the result is an area.
$$ F(x) = P(X \leq x) $$
The survivor function $S(x)$ of a random variable $X$ is defined as the function of $x$ equal to the probability that the random variable $X$ is greater than the value $x$. This is the complement of the CDF $F(x)$.The quantile $v$ of a CDF is the point $x_v$ at which the CDF has the value $v$. More precisely, $F(x_v)=v$. A percentile is a quantile in which $v$ is expressed as a percentage.
$$ S(x) = P(X > x) $$
Example 1.3
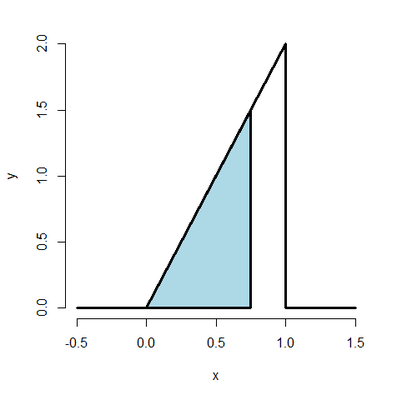
Suppose that the proportion of help calls that get addressed in a random day by a help line is given by
$$f(x)=\begin{cases}2x & \text{for } 1 > x > 0 \\
0 & \text{otherwise}\end{cases}$$
What is the probability that 75% or fewer of calls get addressed?
x <- c(-0.5, 0, 1, 1, 1.5)

y <- c( 0, 0, 2, 0, 0)

plot(x, y, lwd = 3, frame = FALSE, type = "l")

polygon(c(0, .75, .75, 0), c(0, 0, 1.5, 0), lwd = 3, col = "lightblue")
From the CDF
$$ F(x) = P(X \leq x) = \int 2x \ dx = x^2 \ \ \ \ for \ \ 1 \geq x \geq 0 $$
.75*.75
0.5625
$$ \int_0^.75 2x \ dx = .75^2 - 0 = .5625 $$
f <- function(x){2*x}

integrate(f, 0, .75)
0.5625 with absolute error < 6.2e-15
pbeta(.75, 2, 1)
0.5625
Answer: the probability that $75$% or fewer calls get addressed is $56,25$%, in a given day (or on average).
Quantiles
By Cumulative Distribution Function (CDF), we denote the function that returns probabilities of $X$ being smaller than or equal to some value $x$,
$$ P(X \le x) = F(x). $$
This function takes as input $x$ and returns values from the $[0,1]$ interval (probabilities) let´s denote them as $p$.
The inverse of the CDF (or quantile function) tells you what $x$ would make $F(x)$ return some value $p$.
$$ F^{-1}(p)=x $$
The $\alpha^{th} \ \text{quantile}$ of a distribution with function $F$ is the point $x_\alpha$ so that
$$F(x_\alpha) = \alpha$$
The $.75^{th} \ \text{quantile}$ of a distribution is the point so that $75$% of the mass of the density lies below it.
qbeta(.75, 2, 1)
0.8660254
From Example 1.3, we foud that the probability that $75$% or fewer calls get addressed is $56,25$%. In other words, $56,25$% of the mass of density lies below the point where $x=.75$.
qbeta(.5625, 2, 1)
0.75
A percentile is simply a quantile with $\alpha$ expressed as a percent rather than a proportion. The (population) median is the $50^{th} \ \text{percentile}$.
Conditional probability
Conditional probability is a very intuitive idea, “What is the probability given partial information about what has occurred?”
We can formalize the definition of conditional probability so that the mathematics matches our intuition.
Let $B$ be an event so that $P(B)>0$. Then the conditional probability of an event $A$ given that $B$ has occurred is:
$$P(A|B)=\frac{P(A\cap B)}{P(B)}$$
$$P(B|A)=\frac{P(B\cap A)}{P(A)}=P(A|B)\frac {P(B)}{P(A)}$$
If $A$ and $B$ are independent, then
$$P(A|B)=\frac{P(A)P(B)}{P(B)}=P(A)$$
Random variables are said to be $iid$ if they are independent and identically distributed. By independent we mean “statistically unrelated from one another”. Identically distributed means that “all have been drawn from the same population distribution”
Bayes´ Rule
Bayes’ rule allows us to reverse the conditioning set provided that we know some marginal probabilities.
Formally Bayes’ rule is:
$$P(A|B)=\frac{P(A|B)P(B)}{P(A|B)P(B)+P(A|B^c)P(B)}$$
$$P(B|A)=\frac{P(A|B)P(B)}{P(A|B)P(B)+P(A|B^c)P(B^c)}$$
A discrete (random) variable assumes only values in a discrete (finite or countable) set, such as the integers. Mass functions will assign probabilities that they take specific values. Continuous (random) variable can conceptually take any value on the real line or some subset of the real line and we talk about the probability that they lie within some range. Densities will characterize these probabilities. ↩︎
A scalar is an element of a field which is used to define a vector space. In linear algebra, real numbers or other elements of a field are called scalars. ↩︎
More formally, a multivariate random variable is a column vector $X=(X_1,…,X_n)^T$ whose components are scalar-valued random variables on the same probability space as each other, $(\Omega, F, P)$ where $\Omega$ is the sample space, $F$ is the sigma-algebra (the collection of all events), and $P$ is the probability measure (a function returning each event´s probability). ↩︎